We’re back again for the yearly WinnerOdds Tennis results, this time seeing what we can glean from the 2024 performance.
This year I’m really starting to notice that the historical results are harder to extract every time.
Managing such an enormous trove of information takes more time than ever.
Because yes, Winners, the Excel file where we store everything has long since ceased to be a mere data sheet: it’s a total behemoth of data, a .xlsx monster with hundreds of thousands of rows that grows more colossal each year. But it’s all good—this only tells us two things: first, I’ll probably need to think about upgrading my laptop, and second, WinnerOdds is racking up more years and picks under its belt, which is always good news.
So, without further ado, here’s a breakdown of the WinnerOdds Tennis 2024 results.
Let’s get down to business.
General Stats:
Since May 2016, when we started to output bets, we’ve recorded 85,000 unique bets.
This is what the total profit graph in units looks like:

Profit in units from all placed bets:
- The green line shows the units gained when wagering the recommended stake on the odds logged by the first user to place each bet.
It’s a “theoretical” graph, as no user could be first to place a bet on every match and have all betting houses available.
- The yellow line shows the units gained when wagering the recommended stake on the average odds per match generated by all our users. It’s generated by calculating the potential profit of every logged bet, the total volume wagered by our users, and drawing out the average odds with the formula 1+(potential profit / wagered volume).
It’s also a “theoretical” graph, as it depicts a user who would place every single prompted bet on the average user odds.
- The blue line shows the units gained when betting on the minimum profitable odds, which can be interpreted as the results that a very slow user would experience—a user who bets on every match right as the odds are about to drop below the minimum profitable odds.
The closest to reality can be found between the blue line and the yellow line. A user who manages to place around 40% of the bets sent by the algorithm.
In 2024, we’ve reached more than 12,000 bets per year, a figure that aligns with previous years.
And this, translated into more tangible numbers, means that an average user places around 400 bets per month.
Fine.
The total profit of WinnerOdds, which appears on the homepage, across all recorded bets is as follows:

This is not a mere record, but a milestone, as 2024 will always be remembered as the year we definitively consolidated eight-figure profits, surpassing the 12 million euro mark for the first time.
But anyway, let’s keep going with the data. 
If, instead of using the X axis for the number of bets, we use it to represent time, we can observe the total profit generated over time.
It shows a rather prosaic first few years, climbing up at a slow rhythm that stopped in 2019, a spectacular year that kick-started an updraft only interrupted by Covid in 2020. Afterward, we see a different but also positive course in 2021 and 2022.
The rising pattern continues on to 2023, reaching the maximum sum by the end of the graph and scratching that glorious 10 million euro mark.
In 2024, we kicked things off around our 75,000th bet, and despite going through two hefty drawdowns (we’ll look at them in detail), the profit—just as you can see in the image below—continues to climb like a never-ending stairway.


What was the biggest drawdown?
Every time the profit graph drops relative to the previous maximum profit, we can calculate the drop—or drawdown—and we can see this very clearly in the graph below. Each peak is a drawdown, and each drop to 0 means we have recovered from the fall.
The maximum drop in euros lost by all users at some point occurred precisely at the end of 2021, with a figure close to 300,000 euros.
It is possible that these drawdowns will become larger over time, as the average bankroll of users has increased in recent years. The important thing here is to keep the risk controlled relative to the total bankroll.

In 2024, as I mentioned earlier, we experienced two heavy drawdowns marked with both arrows.
If you’ve understood what the graph represents, you’ll see we’re currently traversing a really good period.
In fact, as we place more and more bets, the likelihood of facing a maximum drawdown increases, as much as we hope it takes a while to repeat.
Neglecting to consider this causes some of our users to stop using the tool out of frustration. I also wrote about this, as it’s paramount to diagnose it if you want to make money with WinnerOdds.
– Why people fail to use WinnerOdds properly
As far as the total wagered volume goes, we can see that it follows a fairly steady growth pattern, although due to the average user bank having increased in recent years, the incline gets steeper by the end.

We’re dealing with pretty significant figures, exceeding the 250 million euros of total bet volume—quite an achievement!
Result Charts
Following recent results, many users see patterns where there are none:
“I don’t win on qualifiers,”
“Fridays are always a loss!”
“Every time I lose a big bet, the whole week is ruined.”
etc…
Well, if we look at the data, we see that this is a biased reality, and the best decision remains…
…to let WinnerOdds decide when and how much to bet.
Let’s take a look.
Profit per round
What these tables show us is something we already know but sometimes find hard to accept. There are no tournament rounds more profitable than others, at least not enough to make unilateral decisions.
What we do observe is that following the system and making all the bets it sends you without discriminating by rounds, tournaments, or days of the week benefits you.

2024 hasn’t really deviated from the standard, landing with a final yield of 5.1% after nearly 12,000 bets.
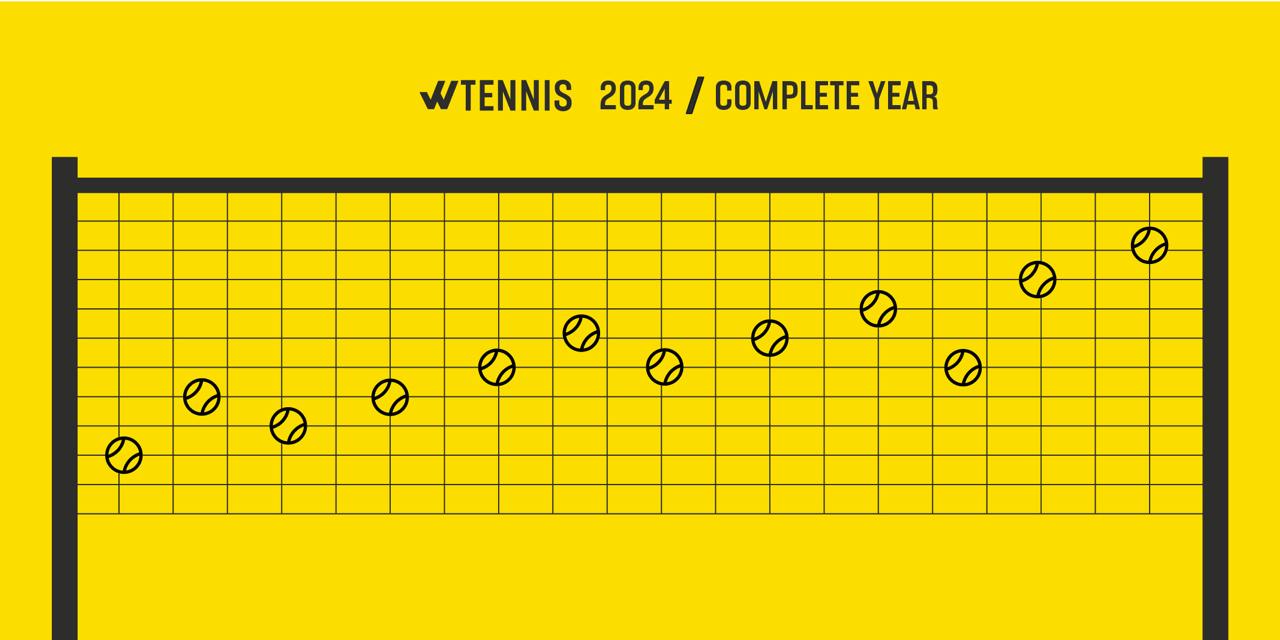
Profit per month
There is a belief ingrained in the investing community that the beginning and end of the season are less profitable. This is especially pronounced in tennis because the season practically stops in December. However, matches—though fewer—continue to be played, and the algorithm keeps delivering good results.
Look, if you want to unsubscribe in December because you want a break, that’s fine. But if you do it because there are fewer matches, because you think the players are going to rest, drop out to go on vacation with their family, or are physically worn out, know that this is not a good decision.
We repeat this every year in our articles, because the data keeps telling the same story despite the persistent notion that the end of the season is less profitable. The numbers show no such correlation. In fact, it’s almost the opposite.
Indeed, over the long term, December ends up being the second most profitable month in terms of yield—contrary to what many might expect. And in 2024, it’s been the third most profitable month, right alongside January and March.

The same chart in euros paints a slightly different picture, generally a little worse as far as yield goes, but it’s the most realistic outlook we have available, and it still comes out positive across the board.
Take a look at how the whims of variance go:
After April, which was the worst month of the year, May steps in with the best month, providing more than a fourth of the total profit in a single month.

Profit per day of the week
These charts aren’t so different from the round stats, but since qualifiers are sometimes played on Sundays, let’s take a look at the overall results sorted by day of the week.

In 2024, 8 weeks out of the 28 have been negative.
In other words, 75% of them have been positive.
If you’re the type of person to say, “this week is in shambles…” “we can’t get out of the pit…”
…broaden your scope and keep placing bets

Frequency of bets by day and time
Here are a handful of useful charts to help you figure out when to expect the most notifications.


Knowing when you’re likely to receive new picks can help with creating efficient routines and habits.
Frequency of matches by day and hour
Mostly just to satisfy your curiosity—especially if you’re the kind to watch every live match on your three-monitor setup—these charts detail when relevant matches start.


Evolution of the total profit in candlestick charts
Even though we’ve already looked at the evolution of the total profit over time, using candlestick charts to depict the same growth better highlights the number of positive and negative periods as well as the maximum swings within them
As you can see, the predominant color is green, a sign that the system has consistently been profitable since it was launched.

And as we did last year, and since it’s almost impossible to show so many years without the image getting distorted, I have decided to publish the candlestick chart for each year.
This will help you take in all the craziness that we’ve achieved since WinnerOdds’ inception and visualize its evolution year by year. You’re sure to identify two standout years.
2020—the pandemic and the great fall. It was our major descent (which we overcame, all needs to be said).
2022—utter madness of a year. Hardly any drawdowns and a vast majority of positive weeks amassing more and more profit non-stop.
And now 2024, adding nearly an extra €2 million. If you take a look, you’ll see multiple 2024 weeks in red, which signal the significant drops of the year.
Here are all the graphs so that you can take your own conclusions:


Yearly evolution
If we establish that tennis runs at yearly intervals based on the vacations in December and the different court surfaces, analyzing our results per year can give insight on how the system has evolved, although the progression is also influenced by how bookmakers have adapted.


As evidenced here, from 2018 onwards, the system started to spot many more valuable selections than before, and despite the slightly lower yield, the profit increased thanks to the much higher volume (except in 2020 due to the nearly 6-month-long Covid interruption).
And in 2024, despite it all—the aggressive betting limits and account closures—we’ve closed the year with a yield in Euros of 4.73%, improving the 2023 results.
Results per competition
The users who refresh their stats page every 10 minutes love to hold grudges against particular selections.
Are Challenger games really profitable? Is betting on WTA and ATP actually worth it?
Here is the data categorized by competition, both globally and in 2024.

As we see in global samples, like the first graph, the numbers are very stable and there are hardly any differences between tournaments in terms of yield. However, if we look at the second table, the one for 2024, we see that short- and medium-term variability is very high.
For example, in 2024, the winners were Challenger and WTA Women.
The purpose behind these graphs, other than satisfying your curiosity, is seeing how everything becomes stable in the long term, whereas variance really strikes in the short term. Understanding that gains are not linear will help you on your path as an investor.
Bets per week
The increase in bets can also be observed by looking at the number of weekly bets placed over the years:

Since mid-2018, we’ve prompted up to 350 bets per week. In 2023, we reached the 500 bets in a single week, setting another absolute record.
If we look at the purple line, in 2024 we are on the higher end of weekly bets.
If we also consider the number of weekly matches, we can compute the percentage of matches we bet on.


Here we can see that the ratio of matches bet lowered a little in 2024.
Overall user profit per selection
Among all users, how much do we gain or lose with every bet?
Take a look. This is the distribution, and as you’ll clearly see, there are more winnings than losses.
Often, we make very little back in a single match (few bets on a few bookmakers), but as a whole, we nickel-and-dime our way through.

The disparity is because the average weighted odds we bet on are inferior to 2.
However, the hit rate hovers at around 70%, which, collectively, lets us make more money than we lose.
The max we lost in one fell swoop was -€68,000, in the Jodie Anna Burrage vs. Quinn Gleason match—we bet on Burrage at 1.14 odds, and the result was 5:7 6:3 7:6 (4).
And the most we gained at once was €23,680, in Pyton Steams vs. Daryka Kasatyna, at 3.38 odds and a final scoring of 7:5 6:2. Bless their hearts.
Real yield vs. expected yield

This graph shows the yield obtained based on the relationship between the betting house’s odds and our minimum profitable odds.
It reveals various interesting facts:
Even after all these years, betting on the minimum profitable odds returns a yield above 0%. In periods where the expected yield was 2%, we obtained an even better one, close to 4%.
The higher the odds relative to the minimum profitable odds, the higher the yield obtained, but it’s not a proportional measure, as a massive difference doesn’t lead to a massive yield.
It’s a sign that when WinnerOdds’ estimations vary wildly with what bookmakers display, both of us are likely overestimating the probabilities of a certain result and its counterpart.
While, indeed, the greater the difference between the betting house’s odds and our minimum profitable odds, the greater the yield, we must apply a fractional Kelly criterion to determine the stake size, as an unmodified Kelly criterion wouldn’t take into account any potential errors in our calculations.
Little discrepancies between betting house odds and our estimations are far more common, which is only logical considering both of us draw from similar information sources.
Conclusions
Only a few years left before WinnerOdds reaches its first decade, and if 2024 has made anything clear, it’s that the journey is still the same: full of ups and downs, moments of hardship, and plenty of joyous triumphs.
Variance has once again reminded us how unpredictable it can be, with an April we’d rather forget and a May that ended up being our best month of the year, accounting for nearly a quarter of our annual profit. For those of us who’ve been around a while, this is no big news.
What truly matters is that the method keeps working. We’ve surpassed 12 million euros in earnings, and despite everything, we continue growing while the community remains as strong as ever.
What pleases me most is seeing more and more finally really grasp how this works and stand firm over the long term, without veering off course when challenges arise. To put it in perspective, the average tennis bankroll per user today stands at €7,500, whereas not too long ago, back in 2020, it was around €3,000.
This speaks volumes about the system’s evolution and the growth of an entire generation of users who have taken the bull by the horns and learned how sports betting works.
A solid system, plenty of volume, and +EV bets. That’s all you need.
We’re heading into our ninth year fully convinced we can keep winning. We know variance has no memory—that we’ll face more twists and turns—but we also know if we stick to the plan, the results will come.
So let’s keep pushing forward. On to 2025. 
Best,
Miguel Figueres